Computer vision revolutionizes sectors
Computer vision represents a major advance in the way we interact with the digital world. It allows machines to understand and interpret the visual content of the real world automatically, revolutionizing various sectors such as retail, logistics, transportation, and many others. At XXII, we are convinced that this technology is an essential lever for improving operational efficiency and decision-making.
The importance of transforming data into useful information
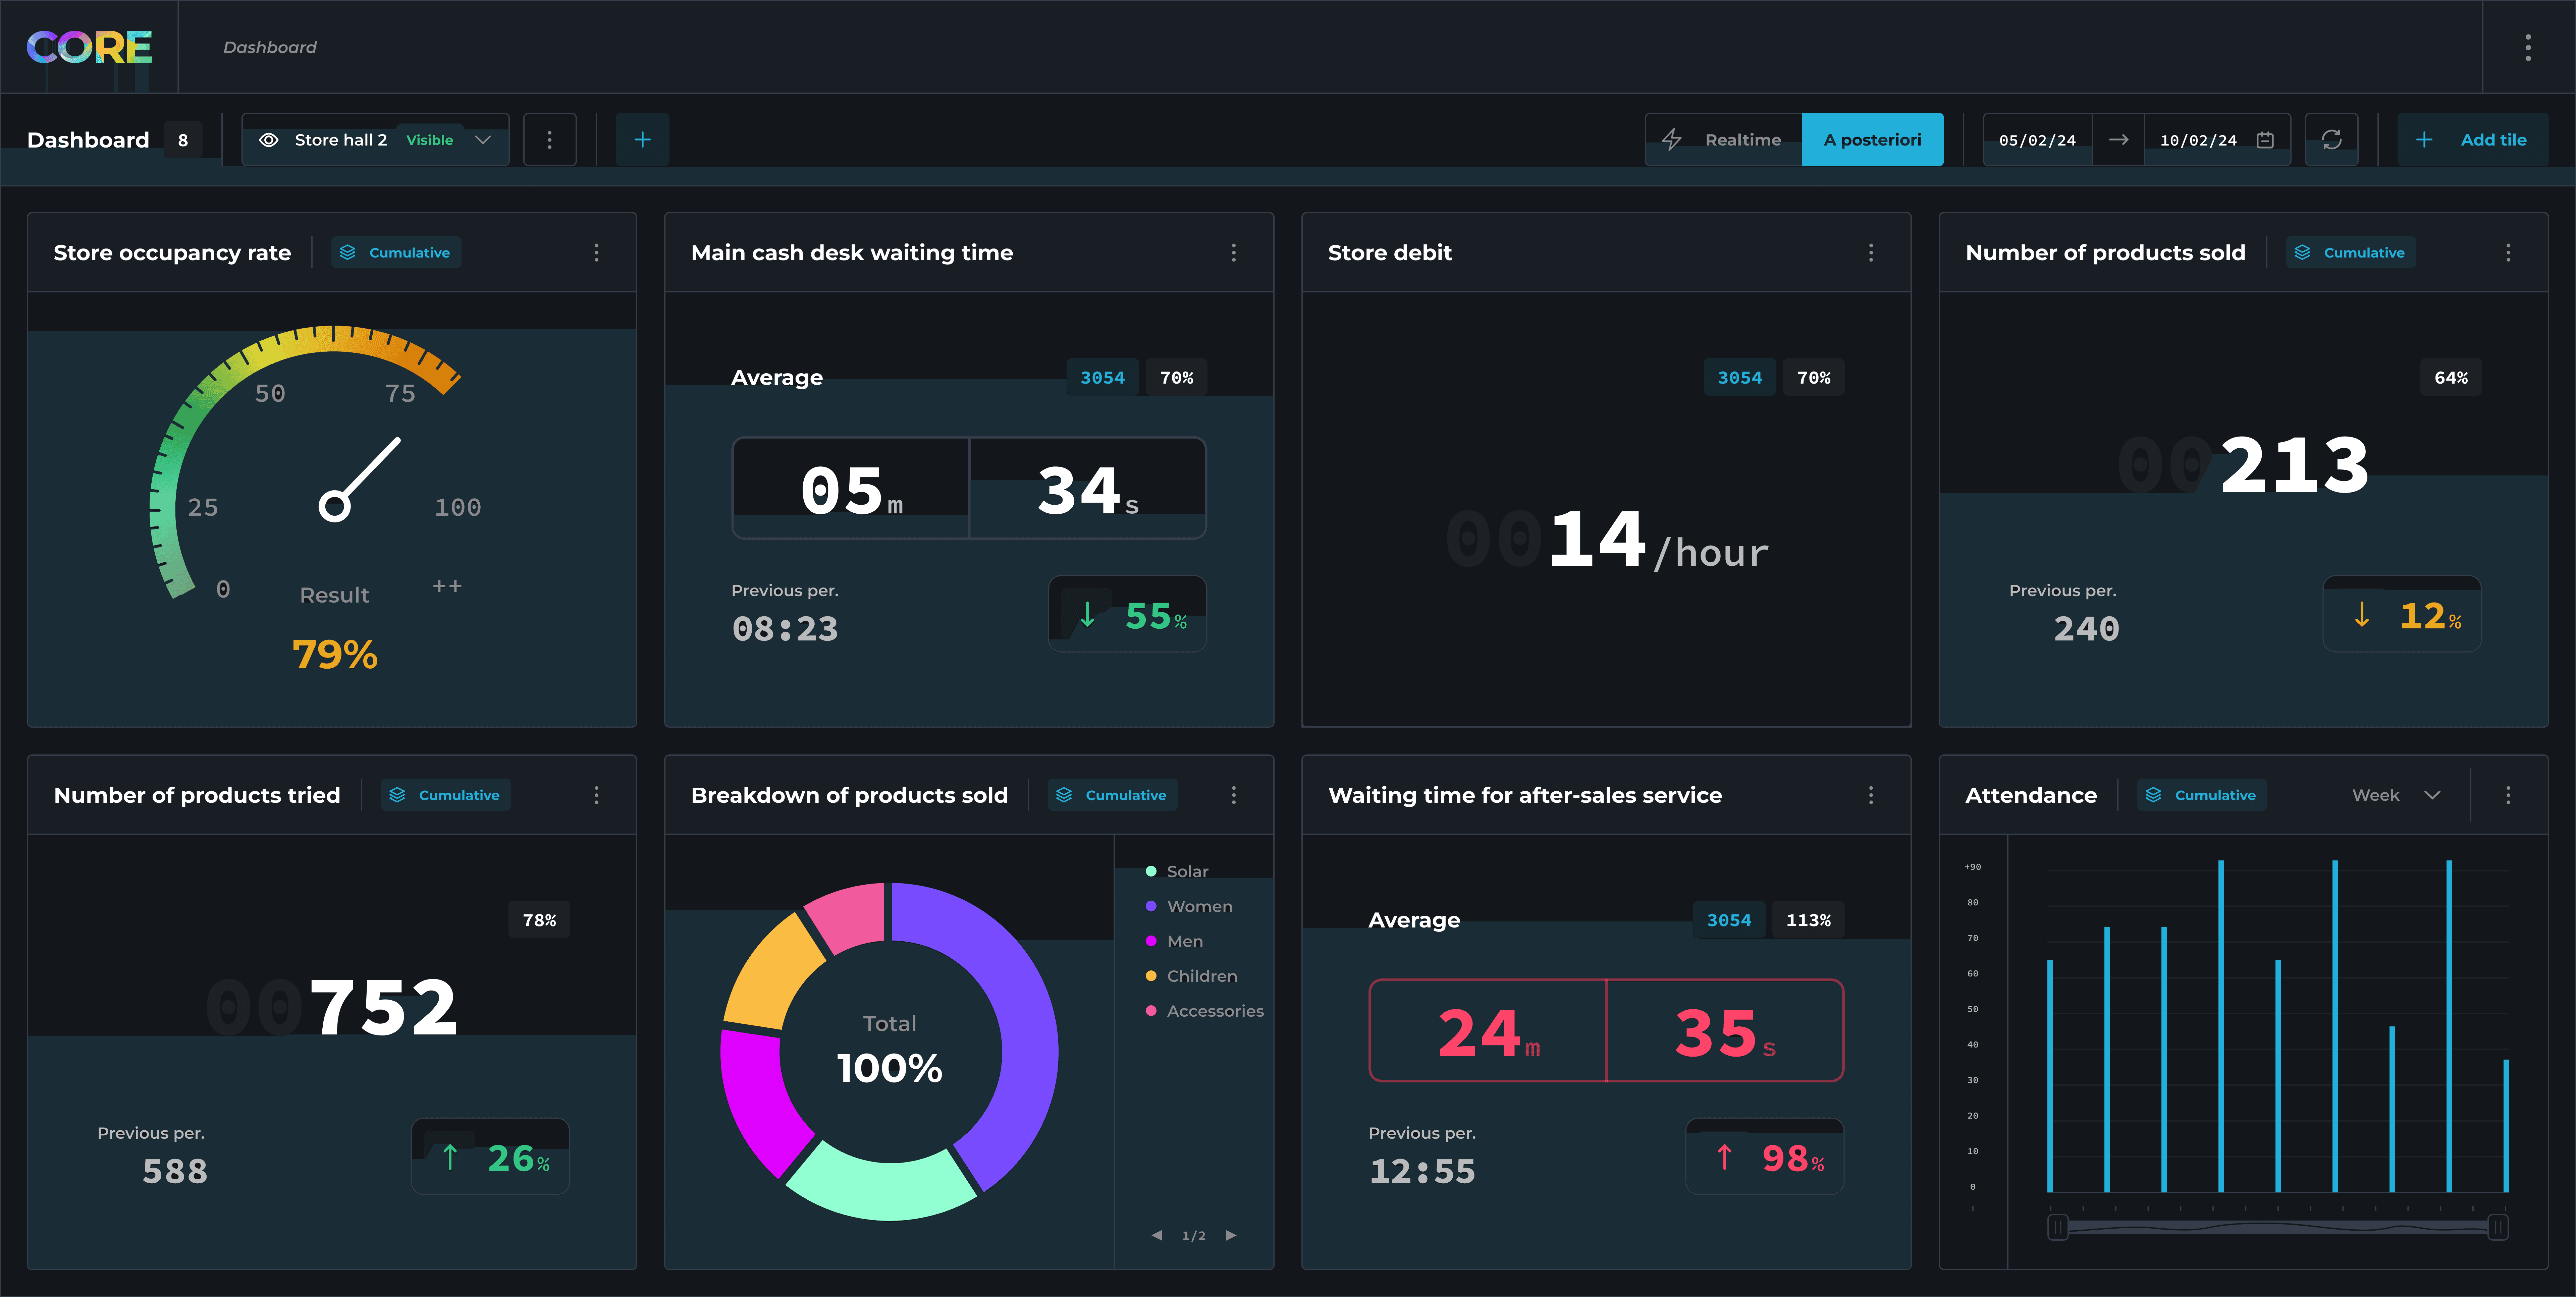
For businesses, it is not enough to just collect data, it is crucial to transform it into useful information. This is where our CORE platform comes in, particularly its sophisticated dashboard. Here's how our dashboard helps you make the most of your data:
Data visualization: Users can easily visualize counting and analysis data, allowing for quick and efficient interpretation.
Performance tracking: The dashboard allows real-time performance tracking, helping managers make informed decisions quickly.
Multi-site aggregation: For businesses with multiple sites, data can be aggregated and visualized on a single dashboard, providing an overall view.
Results sharing: Results can be easily shared with relevant teams, facilitating internal collaboration and communication.
Decision-making: With clear and precise visualization, data turns into actionable information, enabling more effective decision-making.
New features of CORE 3.1 dashboard
Local and remote modes with enhanced security
Our dashboard now features local and remote modes, offering increased flexibility for data management. Whether on-site or on the go, you can access your information securely with the addition of HTTPS protocol for remote connections. This enhancement ensures data confidentiality and integrity, reducing risks associated with data transmissions.
Improved CSV exports
Various fixes have been applied to improve the utilization of CSV exports. These fixes include the removal of redundant lines and better data structuring, making exports more usable and reducing the time needed for analysis. All data associated with a tile within a defined time range can be exported for statistical purposes, readable by spreadsheet software such as Microsoft Excel.
Multi-site data aggregation
For infrastructures equipped with multiple XXII instances, the dashboard allows for gathering counting data on a single dashboard. The status of connections from different instances can be monitored from a dedicated page, providing a comprehensive overview and centralized multi-site data management.
Optimized graphical interface
We have also made a point of optimizing the graphical interface of our dashboard. The creation of data tiles is simplified, with a preview available before validation. Tiles can be moved, renamed, or deleted, and pages can contain up to 12 different tiles. These pages can be private, visible to all, or shared with a defined list of users, allowing for increased customization and flexibility.
Data can be visualized in several forms: simple counter, flow meter, waiting time counter, gauge, histogram, pie chart, donut, and curve. This variety of visualizations allows for meeting diverse needs and presenting data in the most relevant way possible.